NEW Trap & Trainer Bias – Selection Hunter For Greyhounds

NEW Trap & Trainer Bias - Selection Hunter For Greyhounds

Whats New: 
  • Trap Bias – A 0–1 score that measures how strongly each trap has historically performed at that specific track (and distance band). A score above 0.50 indicates a positive track bias for that trap, while a score below 0.50 shows a negative bias. This is calculated from thousands of historical races and stretched so that realistic extreme performances sit near 0 and 1.  All historical data up till 25/07/2026 is based on the same 5 years of data. After that date, a rolling 5 years of data is used which is updated daily.  
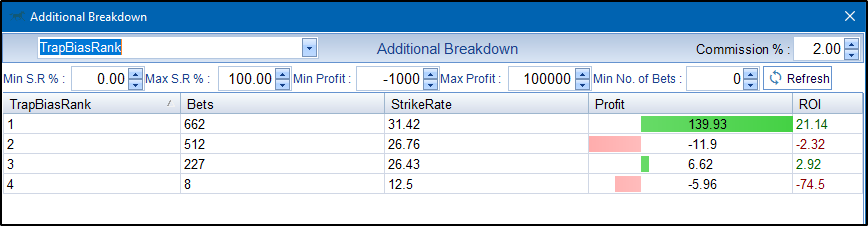
  • Trap Bias Rank –Ranks the six traps in the race from strongest to weakest based on Trap Bias (1 = strongest bias). Equal scores receive the same rank, making it easy to spot when two or more traps share a similar advantage.
  • Trainer Bias – Calculated using a similar method to Trap Bias. It produces a 0–1 score that shows how well the trainer has performed at that particular track over the past five years. Trainers who consistently do well at certain venues are highlighted with higher scores. As with Trap Bias – All historical data up till 25/07/2026 is based on the same 5 years of data. After that date, a rolling 5 years of data is used which is updated daily. 
  • Trainer Bias Rank – Ranks the runners in the race according to their Trainer Bias. This quickly identifies which trainers have the strongest track record at the venue on the day.
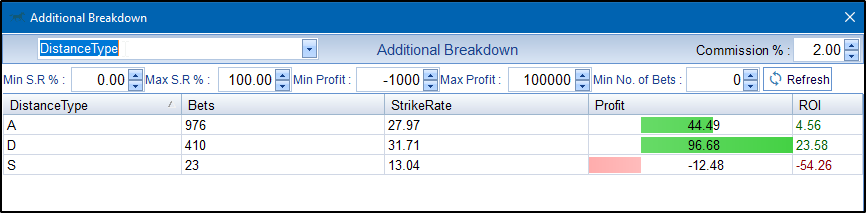
  • Distance Type – The Race Distance is checked against each Race Track for what type of race it is. The 4 types are (D)– Sprint, (A) – Middle, (S) – Stayer, (M) – Marathon. This is espcially helpful when the Race Type is generic such as OR. (Open Race). 
DistanceTypeExample
Distance Type Example Usage

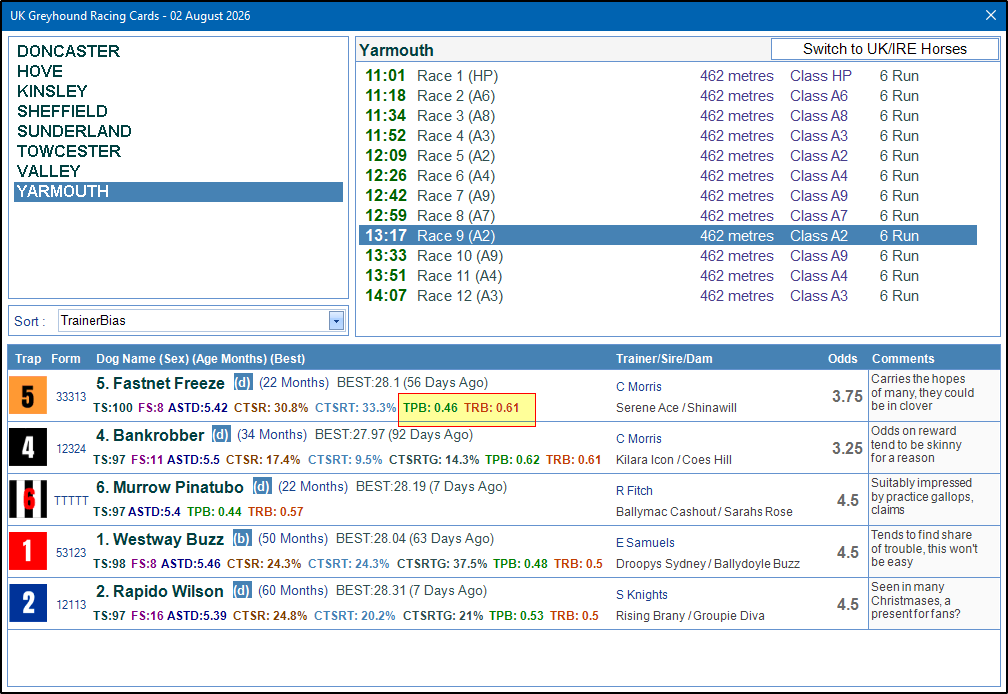
As well as being available in Seletcion Hunter, Trap Bias and Trainer Bias are also shown in the Built in Race Card for Greyhound Racing where you can also sort on Trap Bias and Trainer Bias Rank. 

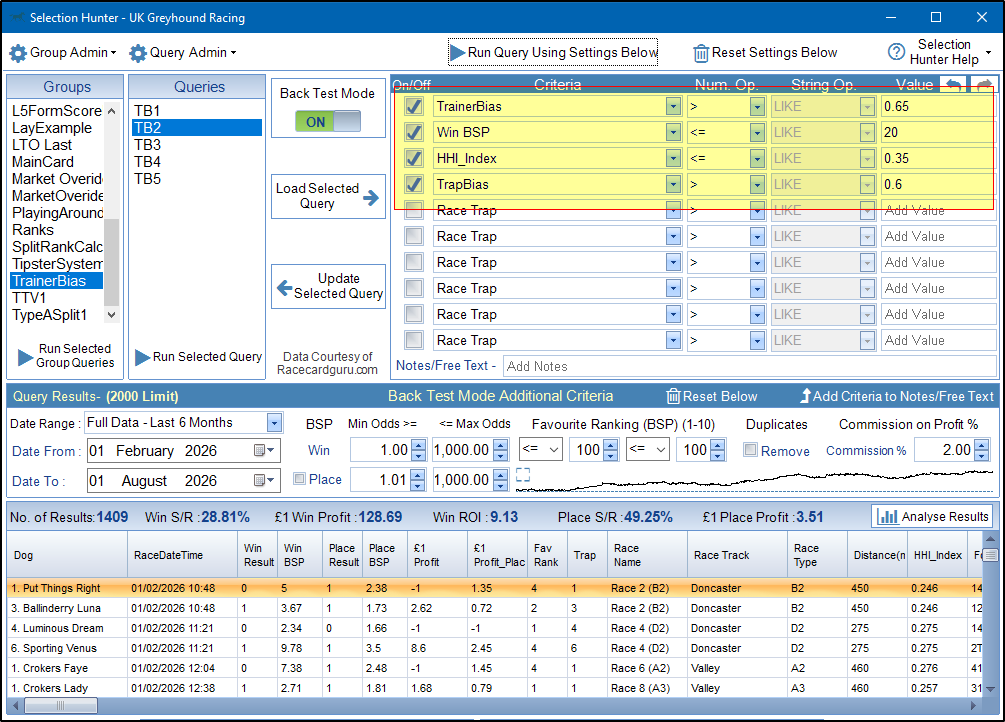
Whilst adding the Trap & Trainer Bias it became obvious from a very early stage how useful they are going to be. Anything over 0.5 shows that Greyhound has a greater chance than the expected odds of 1 in 6. There are some tracks where it is more noticable than others. There are also plenty of generic systems that can show up such as this example. Trainer Bias > 0.65 and Trap Bias > 0.6. Apply to fairly open races (HHI <= 0.35) and keeps odds less than 20 to reduce long losing runs. Over the last 6 months this system would of produced 129 points. However – It is important not to read too much into the results. As stated earlier, All historical data up till 25/07/2026 is based on the same 5 years of data. After that date, a rolling 5 years of data is used which is updated daily.  Effectively we have a line of best fit up until 25/07/2026. It is important to treat any previous results with caution and purely as a guide for a few months at least.

If you have a system of your own that you have created it may be worth simply adding Trap & Trainer Bias > 0.5 to increase the strike rate and ROI for that system. 

The new options are all available to view in the Selection Hunter Additional Breakdown. 

Analyse Results –> Additional Breakdown

C:\Users\might\OneDrive\Desktop\DistanceBreakDownAnalysisScreenshot
Distance Type
TrapBiasRankBreakdown
Trap Bias Rank

TSM Desktop & TSMapp (Web Based)

Remember one (1) subscription covers access to both TSM V8 (Desktop) and the TSMapp. (Web Based).

Everytime you login to the TSMapp (Web Based) you will be using the latest version of TSM. If an update is needed, TSM V8 Desktop Software will auto update when you next use it.