
The Herfindahl-Hirschman Index (HHI) Applied to Horse Racing
Introduction – The Herfindahl-Hirschman Index is a straightforward mathematical measure originally developed in economics to evaluate how concentrated a market is. A low score means many competitors hold roughly equal shares, creating a highly competitive environment. A high score indicates that one or a few players dominate, making the outcome more predictable.
Horse racing enthusiasts and analysts have adapted this tool to evaluate the competitiveness of individual races. Instead of company market shares, we use each horse’s implied probability of winning, derived directly from the betting odds. This turns the collective opinion of the betting public into a single number that reveals whether a race looks like a wide-open affair or one dominated by a standout favorite.Why does this matter for bettors?
- It quickly highlights races where upsets are more likely versus those where the favourite is heavily backed for a reason.
- It can guide strategy: more competitive fields (lower HHI) often create better opportunities for value bets, while high-HHI races may suit simpler win bets or be worth skipping if you dislike short prices.
- The beauty of the approach is its simplicity — you only need the current odds and a calculator or spreadsheet.
Calculating Implied Probabilities – For races using decimal odds, the implied win probability for each horse is calculated as:
Probability = 1 ÷ Decimal Odds
Example: Decimal odds of 3.5 mean a probability of 1 ÷ 3.5 ≈ 0.2857 (or 28.57%).
If you work with fractional odds, first convert them to decimal form (add 1 to the fraction), then apply the same formula.
Because bookmakers build in a margin, the sum of all probabilities will usually exceed 1.00.
The HHI Formula: HHI = sum of (each horse’s probability)² for every horse in the race.The resulting number falls between 0 and 1:
- Closer to 0 → highly competitive field with no dominant horse.
- Closer to 1 → one horse is a massive favourite and the race is very predictable.
(Some analysts multiply the result by 10,000 to match the traditional economic scale of 0–10,000.)
In TSM we have the Selection Hunter which can be used for own betting systems. Selection Hunter has the HHI Index as a filter. (Based on the BSP of all selections in that race). We can use the HHI Index to see how our selection systems fare in competitive races and odds on favourite races.
I have used Selection Hunter to display a race from the 19th May.
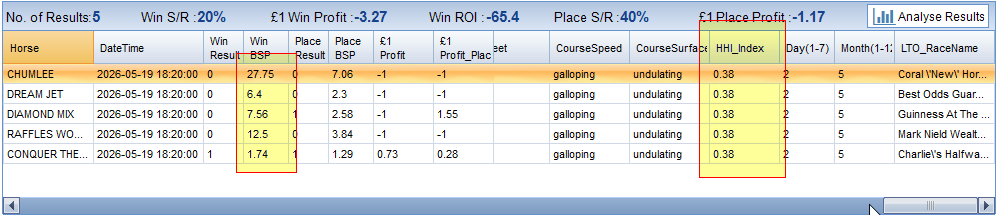
Worked Example – Let’s look how the HHI of 0.38 is calculated.
Horse | Decimal Odds | Implied Probability | Probability Squared |
|---|---|---|---|
1 | 27.75 | 0.036 | 0.0013 |
2 | 6.4 | 0.1562 | 0.0244 |
3 | 7.56 | 0.1322 | 0.0175 |
4 | 12.5 | 0.08 | 0.0064 |
5 | 1.74 | 0.574 | 0.3295 |
Step-by-step calculation: Add all the squared values:
0.0013 + 0.0244 + 0.0175 + 0.0064 + 0.3295 = 0.38
HHI ≈ 0.38 (or 3,800 on the 0–10,000 scale).
Interpretation: This suggests the race is dominated by a favourite and is not particulary competetive. If you were looking to place a value bet, then this would be a race you would avoid.
HHI Benchmark (rough guide for racing):
- < 0.15: Competitive race with no strong favourite. Worth analysing for value bets.
- 0.15 – 0.25: Moderately competitive race. There is a clear favourite, but the race remains open.
- > 0.25: Non-competitive or “chalk” race. This indicates a heavily odds-on favourite dominates the betting pool.
These figurers are guides only and can the thresholds can be higher or lower as per your own preferences.
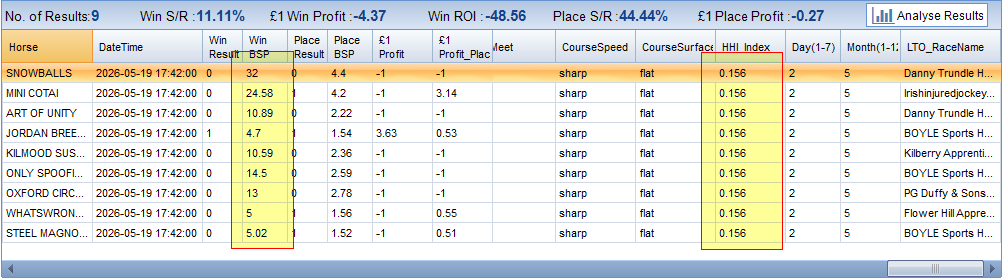
The screenshot below shows another example from the 19th. This one shows a wide range of BSP. There is no clear favourite. The HHI Index is calculated as 0.156. This indicates a moderately competitive field. It is very close to the lower benchmark of 0.15. There is a good chance of finding value bets in the race.
Final Thoughts – Using the HHI gives you an objective snapshot of race dynamics that goes beyond simply looking at the favorite’s odds. It condenses the entire betting market’s view into one easy-to-understand figure. While it should never be your only decision-making tool i it serves as an excellent filter when scanning a day’s racing card.
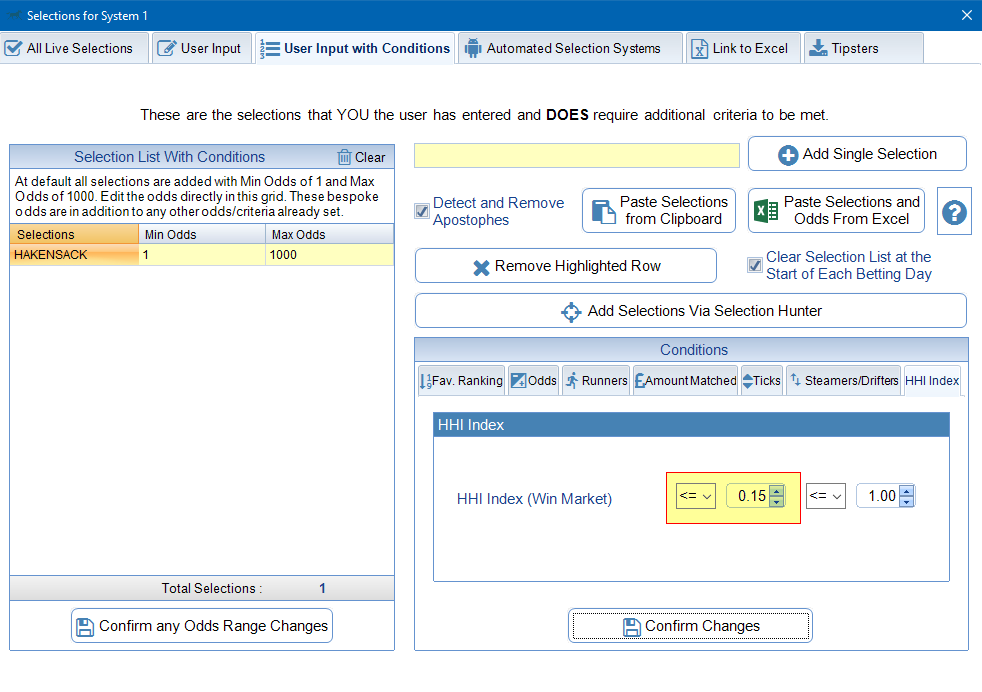
Using Selection Hunter you can create selection systems that only returns results when the HHI Index is below a certain figure.
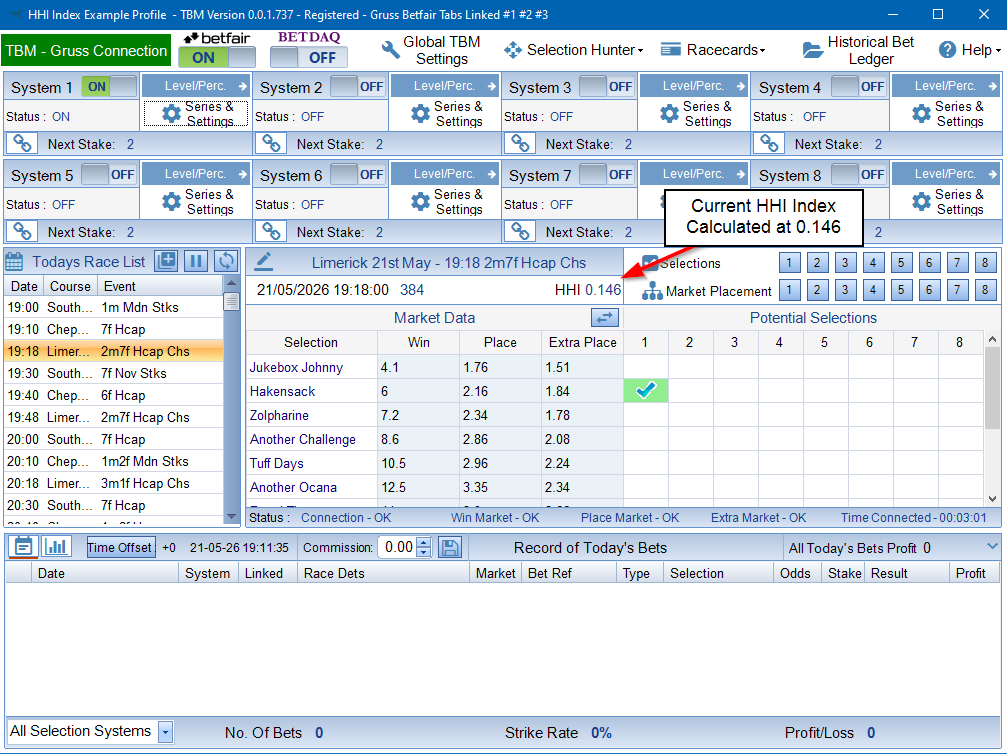
Making Things Automated – Our sister software – Automated Betting Bot – The Bet Machine, there is an option to ONLY place bets where the HHI Index is as per your settings.
User Input with Conditions, Automated Selections Systems and Tipsters all have the option to set a HHI Index level the current market must hit before any bets are placed. In this example I only want to place bets where the HHI Index is less than or equal to 0.15.
We can see that current HHI Index for the market is 0.146. Therefore the bet would be placed and is shown green. If the HHI Index was greater than 1.5 the selection would be shown as orange.
TSM Desktop & TSMapp (Web Based)
Even if you have no use for Selection Hunter, TSM is still the only software you need to record and analyse your betting. With 46 Staking Plans included, all with editable settings you can pretty much create any staking plan out there.
With in-depth analysis, graphs and reports easily look at your historical bet data. Find your own edge.
Remember one (1) subscription covers access to both TSM V8 (Desktop) and the TSMapp. (Web Based).
Everytime you login to the TSMapp (Web Based) you will be using the latest version of TSM. If an update is needed, TSM V8 Desktop Software will auto update when you next use it.