Targets/Stop-loss Analysis
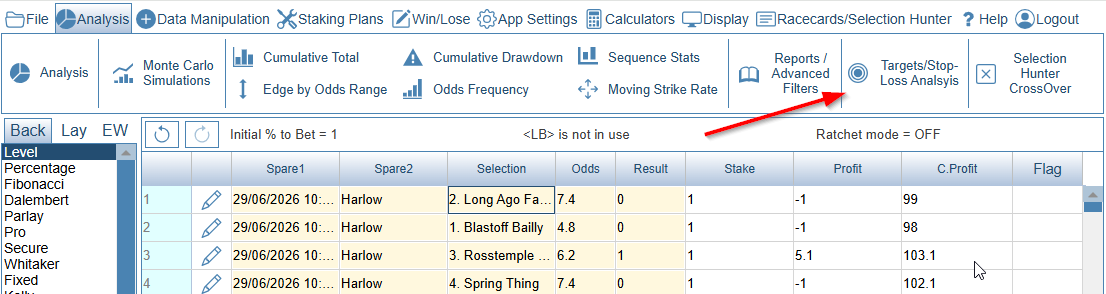
Horizontal Menu - Browser Width Greater Than 1100 pixels (Desktop Computer,Laptop, Some Tablets)
Vertical Menu - Browser Width Less Than 1100 pixels (Some Tablets, Mobile)
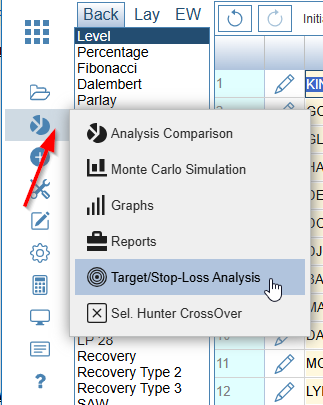
On the main menu select Analysis and then Targets/Stop-loss Analysis.
Targets/Stop-Loss Analysis can be used to test different Target/Stop-Loss Scenarios. One example would be a daily target of £10 to £1 stakes. Another example might be a stop-loss of -£20 for £1 bets.
In order to use this feature your data MUST include:
■A consistent date format in either Spare 1 or Spare 2 column
OR
■<LB> - Last Bet Code in the Selection Column
TSM needs this data so that it knows when the next days betting starts.
After pressing Target/Stop-loss Analysis, a new screen appears similar to below. My data includes the date and time of the bet in the Spare 1 Column. TSM has automatically detected what column (Spare 1 OR Spare 2) contains the date and what the format is. If this needs changing you can do so manually using the radio buttons and drop down.
|
As of August 2026: ■If you are using a BACK Staking Plan -The Targets/Stop-Loss Analysis will calculate your results to £1 Back Level Staking Plan. ■If you are using a LAY Staking Plan - The Targets/Stop-Loss Analysis will calculate your results to £1 Lay Level Staking Plan. If you wish to switch from Back to Lay and vice versa then you will need to exit the Target/Stop-Loss Analysis Screen and Select the correct type of Staking Plan. (Back or Lay). The screenshots on this help page show the BACK Version of the Targets/Stop-Loss Analysis. |

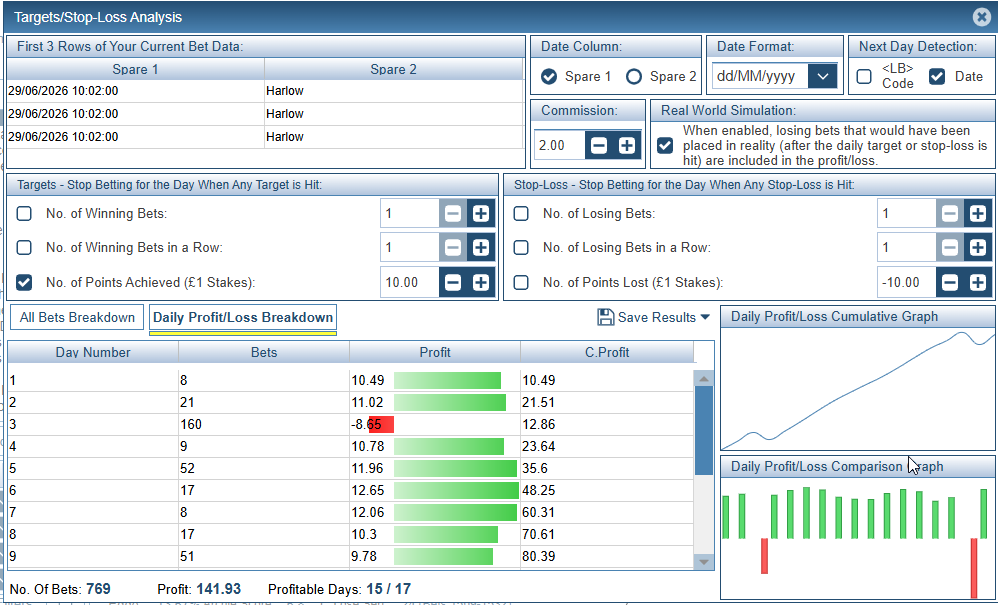
This is a Greyhound system that is undergoing live testing. The raw data shows 2057 bets and a very healthy edge. In this example I have asked TSM what would happen if I stopped betting after hitting 10 points. (£10 if using £1 stakes). The answer is 15 out 17 profitable days. The number of bets has been reduced to 769.
We can adjust the scenario and include a stop loss such as -£10.

In this scenario this decreases our overall profit and we have only 10 out of 17 profitable days. It looks likes this stop loss is too low.
One of the options is Real-World Simulation. When ticked, this will include any bets that were placed at the same time as the bet that caused the target or stop loss to be hit. This only applies if the Time is included in the Date. (Same Minute. Seconds are NOT included).
There are various options to Save the Results.
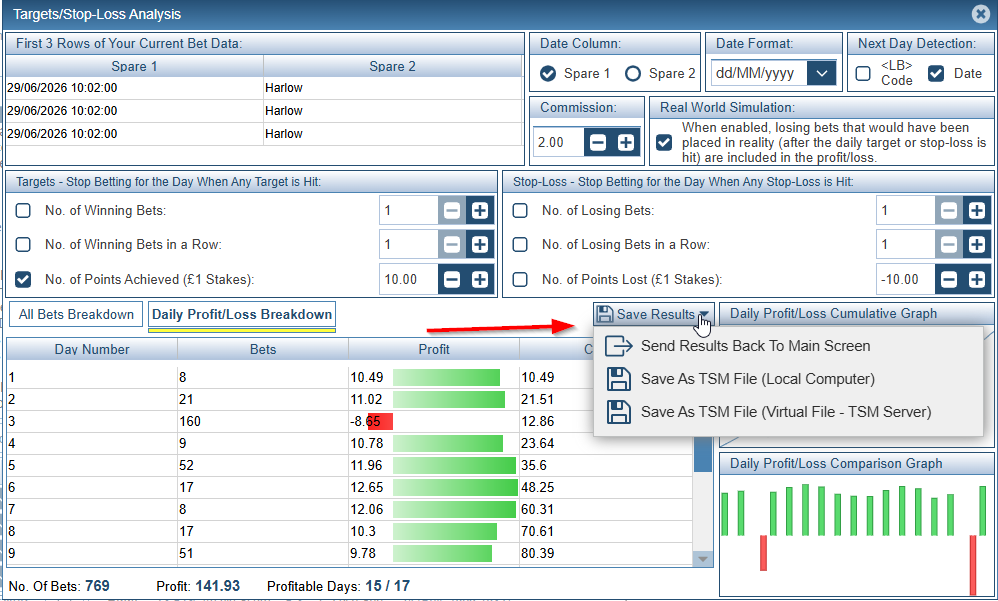
If you send the results to the main screen there is an option to append or replace any data already loaded. If you make a mistake you can always use the Undo/Redo Buttons on the Main Screen.
If you don't have date available for each bet you can also use the <LB> code. In this example data below the <LB> code is used.
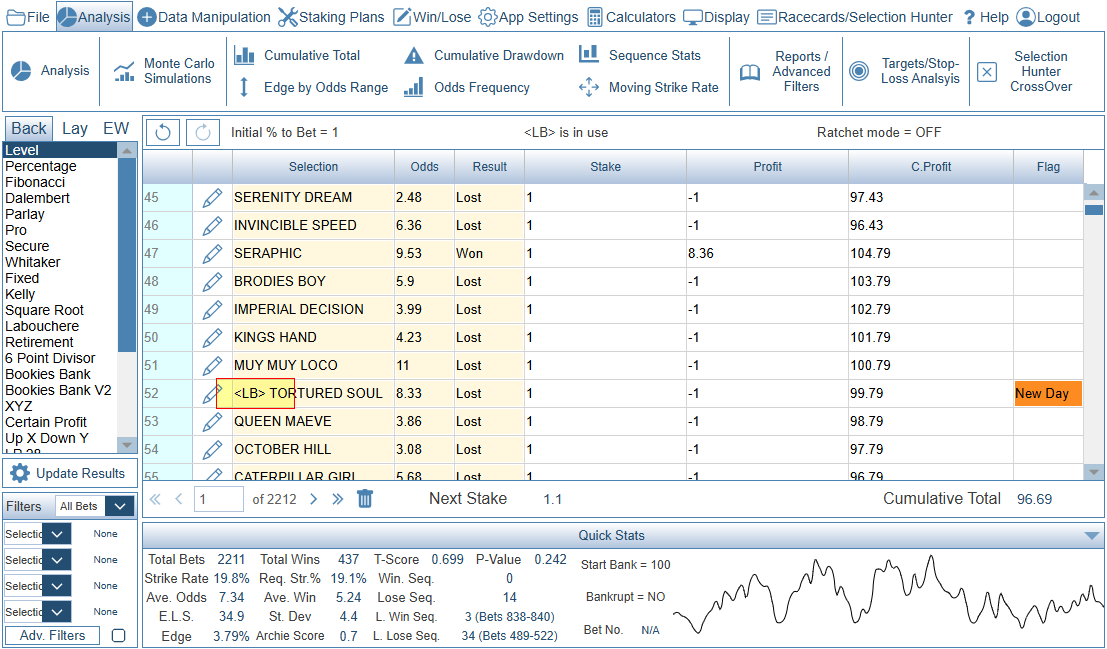
Under 'Next Day Detection' make sure the <LB> code is ticked. In our example below, by stopping each day at 10 points, it shows 26 out 43 profitable days.

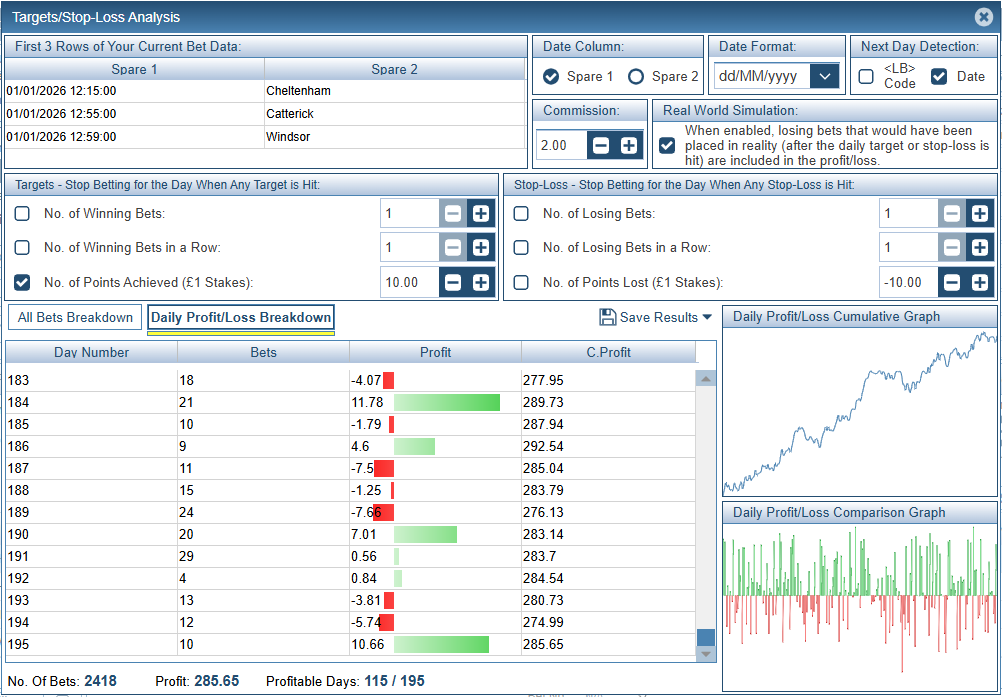
We can also access the Target/Stop-Loss Analysis Screen directly from both Horse and Greyhound Selection Hunter. The screenshot below shows the LTO Ranks Preset for 2026 only. Press Analyse Results to finalise the data.
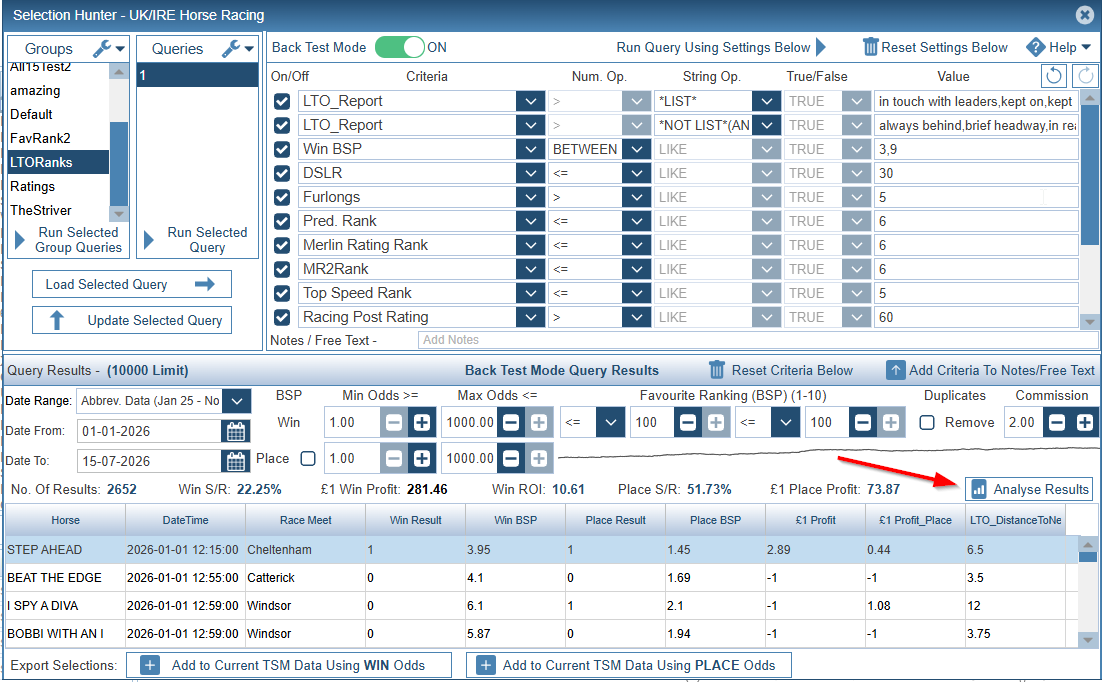
Then press Target/Stop-Loss Analysis.

In this example I am checking again what happens if we stop if 10 points is achieved on any given day. The result is 115 out of 195 profitable days.